Monthly Financial Report for Small Businesses: Templates & How-To
Monthly Financial Report for Small Businesses: Templates & How-To
A monthly financial report is a standardized package that converts your closed books into decision-ready statements, KPIs, and a short narrative — delivered to owners and leadership by business day 10 each month. It answers two questions every time: Are we on track? What do we need to do about it?
Your minimum owner pack includes six standard components:
- P&L vs. budget and prior year — with variance dollars and percent
- Balance sheet — month-end snapshot with working capital highlighted
- Cash flow statement — reconciled from net income, showing cash runway
- AR/AP aging — bucketed by 0–30, 31–60, 61–90, and 90+ days
- One-page KPI dashboard — 5–10 metrics maximum
- Variance narrative — 1–2 paragraphs explaining the top three movements
That is the pack. Everything else is optional detail for analysts and lenders.
Table of Contents
- Why does monthly financial reporting matter for small businesses?
- What core financial statements should you include each month?
- Which monthly KPIs should you track and what do the benchmarks mean?
- How do you prepare a monthly financial report step by step?
- How do you perform variance analysis and write the narrative?
- What templates and layouts work best for small business owners?
- What monthly reporting mistakes should you avoid?
- How do you turn report findings into real business decisions?
- What cadence and roles produce reliable monthly reports?
- Key Takeaways
- Why consistent reporting beats crisis-driven analysis
- Merchantsolutionscorp makes month-end reconciliation faster
- Useful sources and further reading
- FAQ
Why does monthly financial reporting matter for small businesses?
Most small business owners check their bank balance and call it financial reporting. That habit works until it doesn’t — and when it fails, it usually fails fast. A proper monthly financial report gives you the visibility to make real decisions rather than react to whatever your balance says today.

The management purpose is early detection. Cash flow problems, margin slips, and AR shocks rarely appear overnight. They build across weeks, and a consistent monthly cadence catches them while corrective action is still affordable. A regular, predictable “good enough” report beats sporadic perfect reports every time.
Think of cash flow as the vital sign of your business. You can show profit on your P&L while approaching a cash crisis because customers haven’t paid yet. Monthly reporting forces that gap into view before payroll is at risk.
Different audiences need different depths:
- Owner pack — compact statements, KPI dashboard, and narrative; readable in 15–30 minutes
- Manager pack — budget vs. actual detail by department or product line
- Investor or lender pack — full GAAP statements, footnotes, and trend charts
Start with the owner pack. Add layers only when a stakeholder genuinely needs them.

What core financial statements should you include each month?
Three statements form the foundation of every monthly financial report. Each one answers a different question, and together they give you a complete picture.
Profit and loss (income statement)
Your P&L shows whether the business earned more than it spent. For monthly reporting, show month actuals, year-to-date actuals, budget, prior year, and variance in both dollars and percent. Break revenue out by product or service line — a single revenue total hides mix shifts that matter. Always show gross margin in both dollars and percent; that single line tells you more about pricing health than almost anything else.
Balance sheet
The balance sheet is a month-end snapshot, not a trend line. Focus on cash, accounts receivable, inventory (if applicable), current liabilities, and the resulting working capital figure. Highlight material movements versus the prior month — a $30,000 jump in receivables or a sudden drop in cash deserves a note even if the P&L looks fine.
Cash flow statement (indirect method)
Start with net income, then reconcile to actual cash by adjusting for non-cash items and working capital changes. Show major inflows and outflows clearly, and close with a cash runway figure: at the current burn rate, how many months of operating cash do you have? That number is the one that keeps owners awake at night, and it belongs on the front page.
| Statement | Key Fields to Show | Primary Decision It Supports |
|---|---|---|
| P&L | Revenue by line, gross margin %, net income, budget variance | Pricing, cost control, hiring |
| Balance sheet | Cash, AR, inventory, current liabilities, working capital | Liquidity, debt capacity |
| Cash flow | Operating cash, major inflows/outflows, runway | Payroll, investment, financing |
Pro Tip: Keep the one-page KPI dashboard at the front of the package. Owners read the dashboard; analysts use the detail behind it. If your report leads with 20 pages of statements, most owners will skip to the bank balance and miss the story.
Which monthly KPIs should you track and what do the benchmarks mean?
A concise dashboard of 5–10 KPIs is more likely to be read and acted on than a long report packet. Here are the priority metrics for small businesses, with practical benchmark ranges:
- Gross margin % — Revenue minus cost of goods sold, divided by revenue. Benchmarks vary widely by industry; track your own trend and flag any month-to-month decline of more than 2 percentage points.
- Net profit margin — Bottom-line profit as a percent of revenue. Positive and growing is the goal; negative for two consecutive months demands immediate action.
- Operating cash flow — Cash generated from core operations, separate from financing or asset sales. Negative operating cash flow while showing net profit is a red flag.
- Current ratio — Current assets divided by current liabilities. A healthy range for small businesses is 1.5–2.0. Below 1.0 means you may not cover short-term obligations.
- Quick ratio — Current assets minus inventory, divided by current liabilities. Target above 1.0. This strips out inventory that may not convert to cash quickly.
- Days sales outstanding (DSO) — Average days to collect a receivable. Keep this under 45 days; above 60 days signals a collections problem.
- AR aging — Track receivables in 0–30, 31–60, 61–90, and 90+ day buckets. When more than 15% of total AR sits beyond 60 days, treat it as a high-priority cash risk.
- AP aging — Mirror image of AR; know what you owe and when. Stretching payables too far damages supplier relationships and credit terms.
- Burn rate and cash runway — Monthly cash spend divided into available cash. Gives you months of operating life at current spending.
- Revenue growth (month over month and YTD vs. prior year) — The simplest growth signal; context matters more than the raw number.
How do you prepare a monthly financial report step by step?
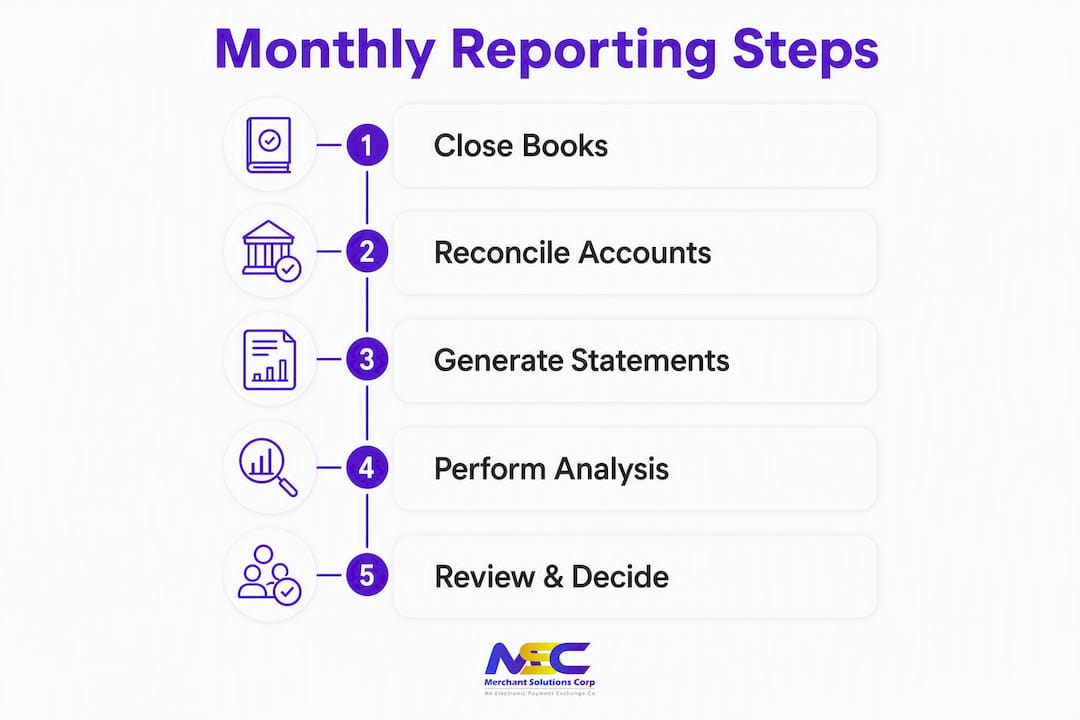
A well-run month-end close should complete within 10 business days. For a small business with a moderate number of monthly transactions and limited accounts and payroll, the total bookkeeping effort typically runs a few hours within a workday. Owner review adds a short additional period of time.
Month-end close timeline
- Business days 1–2: Reconcile bank and credit card accounts. This is the non-negotiable first step. Unreconciled accounts make every downstream number unreliable.
- Business days 3–5: Clear sub-ledgers and record accruals. Match AR and AP sub-ledgers to the general ledger, record payroll accruals, and categorize any uncategorized transactions.
- Business days 6–8: Finalize adjusting entries and draft statements. Lock the period once entries are complete. Run the trial balance, confirm it balances, and generate the three core statements.
- Business days 9–10: Variance analysis and package distribution. Compare actuals to budget and prior year, write the narrative commentary, assemble the owner pack, and distribute.
Close checklist
- Lock the accounting period to prevent late entries
- Reconcile all bank and credit card accounts
- Clear uncategorized or miscoded transactions
- Record payroll accruals and any prepaid expenses
- Review AR aging and flag overdue accounts
- Review AP aging and confirm upcoming obligations
- Finalize trial balance and confirm it ties
- Generate P&L, balance sheet, and cash flow statement
- Write variance commentary for the top three movements
- Assemble and distribute the owner pack
Role assignments
For very small businesses, one person often handles all of this. As you grow, split it:
- Bookkeeper — reconciliations, transaction coding, sub-ledger review
- Accountant or controller — adjusting entries, trial balance, statement generation
- Owner or fractional CFO — variance narrative, decisions, and distribution
If the close is taking longer than 10 business days, the most common culprits are unreconciled accounts and uncategorized transactions. Fix those two first, and the timeline compresses quickly. Accounting integrations that pull payment data automatically eliminate a significant share of manual transaction entry.
How do you perform variance analysis and write the narrative?
Numbers without explanation are just data. The variance narrative is what turns your monthly financial report into a decision tool. The framework is simple: cause, action, expected result — one paragraph per top variance.
Here is a sample variance table:
| Line Item | Actual | Budget | Prior Year | Variance $ | Variance % | Commentary |
|---|---|---|---|---|---|---|
| Revenue | — | — | — | — | — | See note 1 |
| Gross margin | — | 42% | 40% | (4 pts) | — | See note 2 |
| Operating expenses | — | — | — | — | — | See note 3 |
Note 1 — Revenue shortfall: A single large client delayed a $7,000 order to next month due to their own inventory freeze. The pipeline remains intact. No pricing or volume issue is indicated; revenue should recover in the following period.
Note 2 — Gross margin compression: Input costs on the top product line rose approximately 8% in the period. Pricing review scheduled for the 15th; a 3–5% price adjustment is under evaluation to restore margin to the 41–42% range.
Note 3 — Operating expense overage: A one-time equipment repair of $1,800 drove the variance. This is non-recurring. Base operating expenses remain on budget.
When a variance is material — generally more than 15% from budget or outside your normal control limits — document whether the cause is one-time or repeatable. One-time items (equipment repairs, a delayed client order) need a note but not a strategic response. Repeatable causes (rising input costs, a structural decline in volume) need an owner decision and a due date.
What templates and layouts work best for small business owners?
Templates and spreadsheet tools let owners build a repeatable owner pack without expensive software. Three layouts cover most small business needs:
-
P&L-forward owner pack — Leads with a compact income statement showing month and YTD actuals vs. budget, followed by a one-page balance sheet summary and a cash flow snapshot. Best for solo owners and very small teams who want the full picture in two to three pages. Export directly from QuickBooks, Xero, or FreshBooks and add a variance narrative in a cover page.
-
Dashboard-first one-pager — Opens with a KPI summary grid (5–10 metrics, color-coded to target), then links to supporting statements. Best for owners who review weekly and want a fast read. Build this in Google Sheets or Excel; most accounting platforms let you export the underlying data with one click.
-
Budget vs. actual packet — Structured for managers, investors, or lenders. Shows every major line item with budget, actual, variance dollars, and variance percent. Includes the full three-statement pack plus the variance narrative. Use this format when presenting to a bank, an investor, or a board.
To customize any template, start with two steps: group your revenue lines by product or service category, and add a gross margin column to the P&L. Those two changes alone make the report dramatically more useful for pricing and cost decisions. Most accounting platforms support both with a few clicks in the chart of accounts or report settings.
What monthly reporting mistakes should you avoid?
The most common errors don’t come from bad math. They come from process gaps that make the numbers untrustworthy or the report unread.
- Treating reporting as bookkeeping only. Bookkeeping records what happened. Reporting explains why it happened and what to do next. Without a variance narrative, your report is a history book, not a management tool.
- Late closes with stale data. A report issued on business day 20 reflects decisions you could have made 10 days earlier. Set a hard deadline of business day 10 and protect it.
- Unreconciled bank or credit card accounts. Any report built on unreconciled data is unreliable. Reconciliation is not optional; it is the foundation.
- Skipping AR aging. A healthy P&L can coexist with a cash crisis if receivables are aging past 60 days. Check the aging buckets every single month.
- Overly long report packets. A 30-page report that nobody reads is worse than a 3-page report that drives three decisions. Limit the dashboard to 10 KPIs and the narrative to two paragraphs.
- Ignoring cash flow. Net income is an opinion; cash is a fact. Owners who focus only on the P&L miss the liquidity picture entirely.
Internal controls quick check before distributing any report:
- Confirm the period is locked before generating statements
- Verify the trial balance ties to zero
- Cross-check cash per the bank reconciliation against the balance sheet cash balance
- Have a second set of eyes review the variance narrative before distribution
How do you turn report findings into real business decisions?
The report is only as valuable as the actions it triggers. Here are the most common findings and the decision paths that follow:
- Low current ratio (below 1.5): Accelerate AR collections, delay non-essential purchases, and evaluate a short-term line of credit. The goal is to rebuild the gap between current assets and current liabilities before it becomes a payroll problem.
- Rising DSO (above 45 days): Tighten invoicing terms, send statements immediately at 30 days, and call accounts at 45 days. Consider payment links that let customers pay invoices online instantly, which cuts collection cycles significantly.
- Gross margin decline: Evaluate three levers in order: price (can you raise it?), cost (can you negotiate or substitute?), and mix (are lower-margin products growing faster than high-margin ones?). A 2-point margin decline on $1M in revenue is $20,000 in annual profit.
- Negative operating cash flow with positive net income: This gap almost always traces to AR growth or inventory buildup. Find the working capital drain and address it directly.
Liquidity management — particularly AR aging and cash forecasting — is the single most important driver of small-business survival. A business can be profitable on paper and still fail because customers haven’t paid. Cash flow is the vital sign; everything else is context.
Prioritize actions by two dimensions: speed to impact and owner time required. Collecting overdue AR is fast and high-impact. Renegotiating supplier contracts takes longer but compounds over time. Do both, but do the fast ones first.
What cadence and roles produce reliable monthly reports?
A practical reporting rhythm for small businesses has four layers:
- Weekly — Cash balance and AR snapshot; takes 15 minutes and catches problems before month-end
- Monthly — Full close and owner pack; the core reporting event
- Quarterly — Trend review and strategy check; compare three months of owner packs side by side
- Annual — Tax close, audit preparation, and strategic planning baseline
For the monthly close specifically, aim to distribute the owner pack by business day 10. World-class finance teams close in under five business days, but for a small business, 7–10 days is a realistic and valuable target.
Role ownership matters even when one person wears multiple hats:
- Bookkeeper — Bank reconciliations, transaction coding, AR/AP sub-ledger review
- Accountant or controller — Adjusting entries, trial balance, statement generation
- Owner or fractional CFO — Variance narrative, decisions, and stakeholder distribution
For very small businesses, document the close checklist and assign each task a due date within the 10-day window. That single habit — a written checklist with dates — is what separates businesses that close consistently from those that don’t.
Key Takeaways
A reliable monthly financial report requires five core statements, a 10-KPI dashboard, a variance narrative, and a close completed within 10 business days — every month without exception.
| Point | Details |
|---|---|
| Owner pack minimum | Include P&L, balance sheet, cash flow, AR/AP aging, a 5–10 KPI dashboard, and a 1–2 paragraph variance narrative. |
| Close target | Aim to complete the month-end close and distribute the report by business day 10. |
| Cash flow first | Track cash runway every month; a healthy P&L can coexist with a cash crisis if AR aging is ignored. |
| KPI discipline | Limit your dashboard to 10 KPIs or fewer; a concise set gets read and acted on, a long list gets skipped. |
| Merchantsolutionscorp | Integrated POS and payment processing from Merchantsolutionscorp reduces reconciliation friction, making it easier to close on time every month. |
Why consistent reporting beats crisis-driven analysis
There is a version of financial management that most small businesses default to: ignore the numbers until something breaks, then spend two weeks in a forensic deep-dive trying to figure out what went wrong. That approach is expensive in time, money, and stress — and it is almost always avoidable.
The real value of a monthly financial report is not any single month’s numbers. It is the compressed reaction time that a regular cadence creates. When you close consistently by business day 10, a margin problem that would have festered for a quarter gets caught in week five. A collections issue that might have grown into a cash crisis gets flagged at 15% of AR in the 61+ day bucket, not at 40%.
Practitioners who work with small businesses consistently observe that the owners who survive difficult periods are rarely the ones with the best spreadsheets. They are the ones who looked at their numbers every month, understood what they meant, and made small adjustments before small problems became large ones. Consistency is the mechanism. The report is just the tool.
Make the monthly review a non-negotiable calendar event. Block 30 minutes on business day 11, every month, to read the variance narrative and assign at least one action item. That single habit compounds over years into a business that is genuinely hard to surprise.
Merchantsolutionscorp makes month-end reconciliation faster
One of the most time-consuming parts of any monthly close is reconciling payment transactions — matching card sales, ACH payments, and processing fees to your bank statement and accounting records. When payment data lives in multiple disconnected systems, that reconciliation can eat hours.
Merchantsolutionscorp’s payment processing and POS systems are built to reduce that friction. Integrated terminals like Clover feed daily sales data directly into your accounting workflow, so transaction-level detail is already organized before your bookkeeper starts the close. Recurring invoicing and payment links automate AR collection and create a clean audit trail that maps directly to your aging report. For retail and restaurant owners, that means fewer uncategorized transactions, faster reconciliations, and a close that actually hits business day 10.
To see which setup fits your business, contact Merchantsolutionscorp for a no-obligation consultation and get your payment infrastructure working for your monthly close, not against it.
Useful sources and further reading
These resources offer templates, checklists, and benchmarks you can use to build or refine your own reporting process:
- Month-End Close Checklist for Small Business (Catalyst CPA) — Detailed close checklist with time estimates; use it to build your own task list with due dates.
- Monthly Financial Review Checklist: SMB Owners and Cash Flow (Current CFO) — Focused on AR aging and cash flow; the 15% threshold guidance is directly applicable to collections decisions.
- 10 Financial KPIs Every Small Business Should Track (Finntree) — Concise KPI definitions with context on why each one matters for survival and growth.
- Monthly Reports Every Small Business Should Monitor (U.S. Chamber of Commerce) — Authoritative overview from a neutral industry body; useful for benchmarking what mature businesses track.
FAQ
What is a monthly financial report called?
The formal term is a “monthly financial report” or “management accounts.” It typically includes an income statement (P&L), balance sheet, and cash flow statement, along with a KPI dashboard and variance commentary.
How do I make a monthly financial report?
Close your books by business day 10, reconcile all bank and credit card accounts first, then generate your P&L, balance sheet, and cash flow statement. Add a one-page KPI dashboard and a short variance narrative explaining the top three movements.
How long does a monthly close take for a small business?
For a small business with 100–300 monthly transactions, one bank account, and payroll for up to 10 employees, the bookkeeping work typically takes 4–8 hours. Owner review adds 15–60 minutes on top of that.
What is the 12-month financial report?
A financial report for a full year is an annual summary that aggregates monthly statements into a full-year view. It is used for tax preparation, strategic planning, and lender or investor presentations, and it draws directly from the monthly reports produced throughout the year.
How do I know if my monthly report is accurate?
Accuracy starts with reconciliation. Confirm that your bank and credit card accounts reconcile to zero, that the trial balance ties, and that the cash balance on your balance sheet matches the bank reconciliation. Those three checks catch the vast majority of reporting errors before distribution.